The City of Brooklyn, USA (1879)

The City of Brooklyn, USA (1879)

8635 x 5927

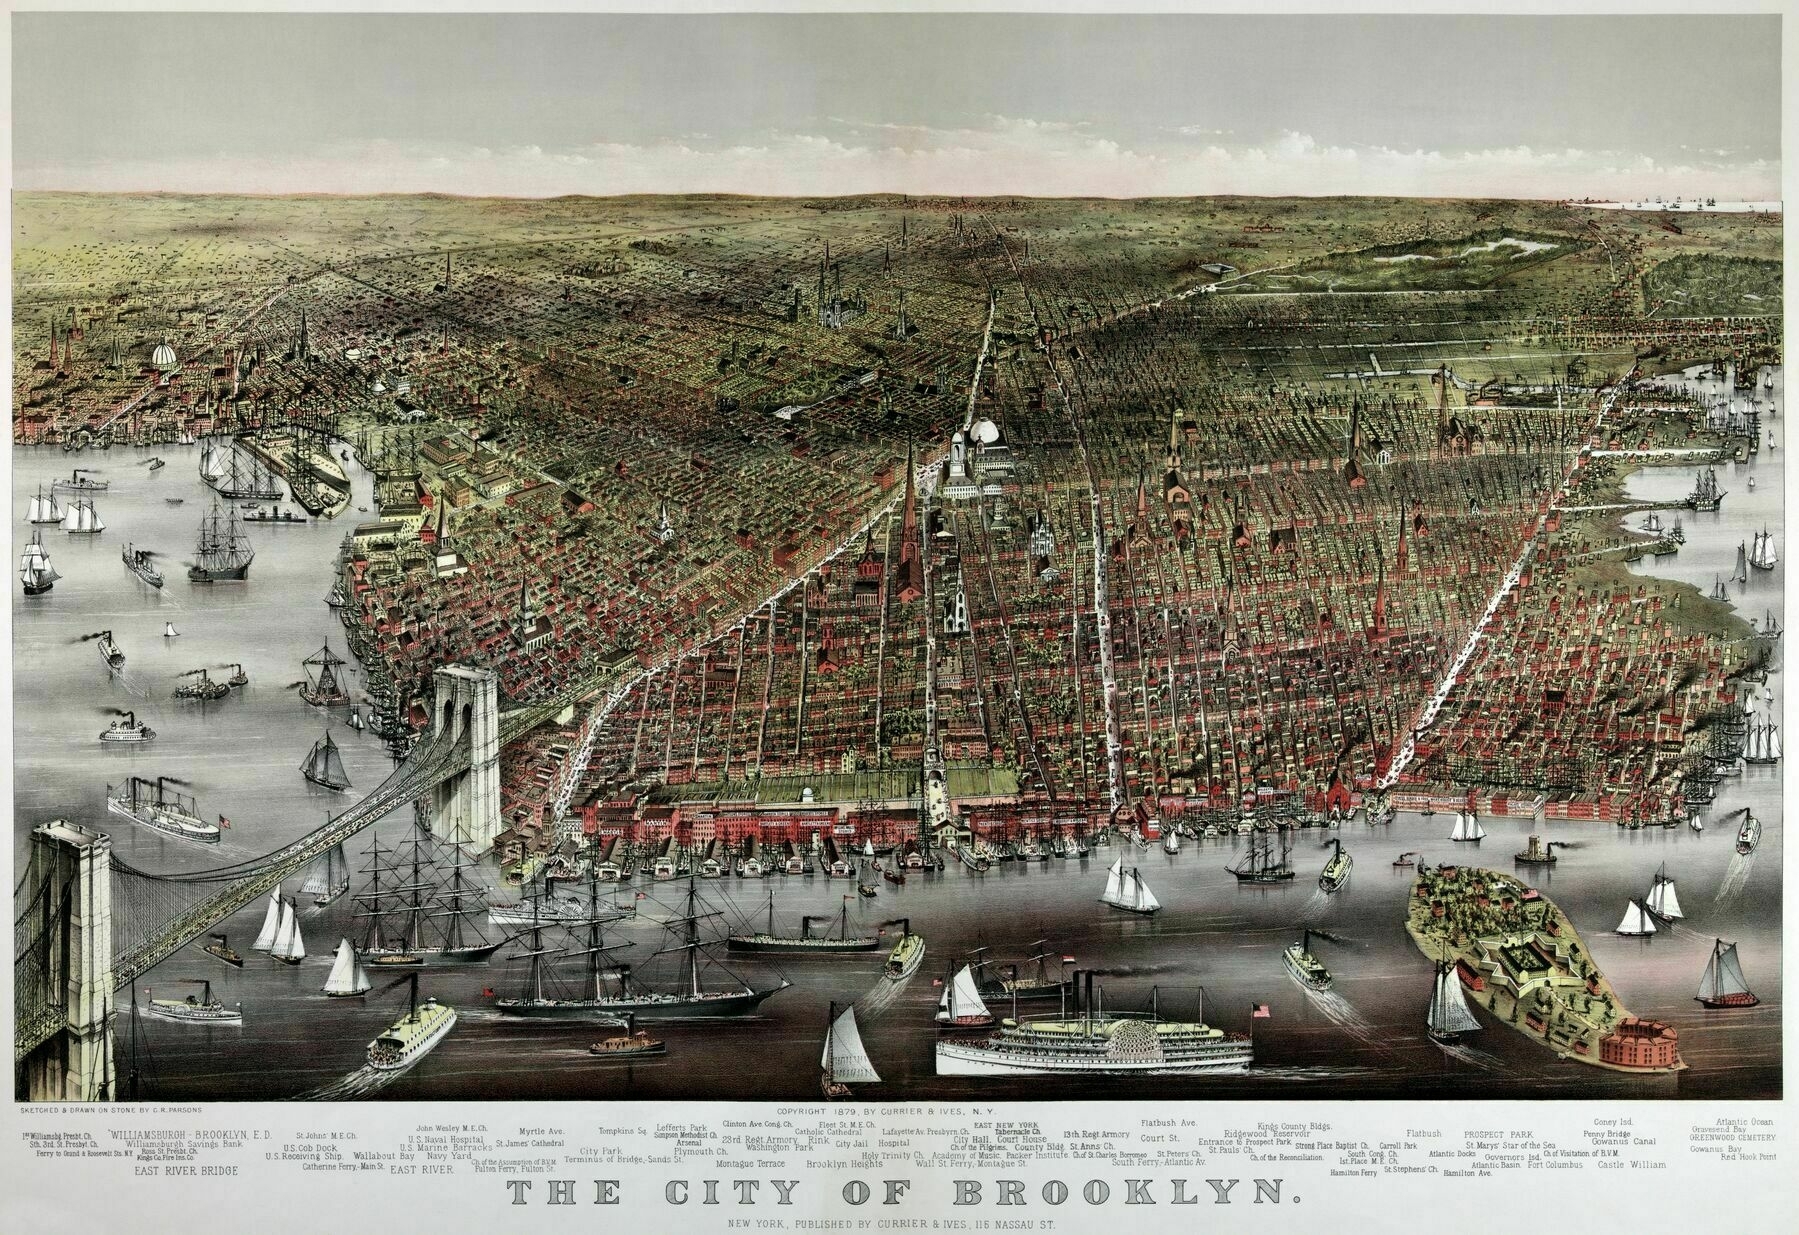
‘I guess I didn’t know offhand when the Brooklyn bridge was built, but if you had asked me I would have definitely guessed sometime after 1900.

The construction commenced in 1869 and was completed in 1883.

It’s designer, John Roebling, has an older bridge, still in use today in Cincinnati, the John A. Roebling Bridge which was built from 1856-1867 which is nearly as grand in stature.’

1720 map showing California as an island

1720 map showing California as an island - by Nicolas de Fer

8015 x 5555

‘Would be interesting to know the route they travelled through California. I guess they crossed the gulf thinking Cali was an Island, and continued north not realising they were on the same landmass they departed from. Looks like they got all the way up to Monterey Bay but still thought they were on an island!

Iirc they sailed across for a long time. The Spanish were also sailing up down the coast. At one point they were sailing between Monterey and Drakes Bay up around Point Reyes which is around the area labeled Mendocino. This route took them by the San Francisco Bay but they didn’t know it was there for like 200 years. They sailed past it and never noticed the inlet because it was always foggy. Another interesting thing is that the area labeled something like “Sebas” is probably the Russian River Basin. This happens to be the most northern extension of the Spanish Empire and the Most Southern extension of the Russian Empire

Thank you for the reply! Had no idea the Russians went as far as California, and I also didn’t notice the “S. Fran” on the map until you mentioned it. Very interesting, I’ll have to look up more about it. Hard to believe that only 300 years ago this was all uncharted territory, for Europeans anyway’

Population density map of the United States in 1790 (published 1903)

Population density map of the United States in 1790 (published 1903)

2829 x 3607

‘White is the populated parts, but not by them

I’m sure I already know the answer to this, but I wonder if the map makers gave any consideration to areas with larger populations that they knew about, and just decided that the the “under 2 per sq mi” still applied in those cases.

Again, I’m thinking I know the answer already. Being generous maybe in “the population” at the top, the means our’

Household Firearm Ownership Rate by U.S. State

Household Firearm Ownership Rate by U.S. State

2560 x 1266

‘Correlates pretty nicely with the North American bear population maps

Meanwhile in WA state we are going to bring the grizzly back while simultaneously restricting access to firearms. Good times ahead

What on earth are you talking about?

The only restrictions I’ve seen is the new bill that limits magazine size to 10 bullets, and requires a permit & firearm safety class for purchase. As a gun owner who lives in bear country, I have zero problems with any of those things.

And reintroduction of the grizzly is going to be incredibly slow. It’s not even guaranteed to work considering the fact that Washington is getting warmer and warmer. There’s not going to suddenly be Alaska lvls of Grizzlies in Washington. That would take decades, if not centuries.

I think you might be over exaggerating the danger, here’

Makers of the U.S.A. : a 1943 pictorial map

Makers of the U.S.A. : a 1943 pictorial map by Louise E. Jefferson

9975 x 6357

‘Yeah, may be a bit quaint and slightly racist today, but this seems oddly wholesome given the time period.

Also broadly kind of accurate, except for the Russian spire that is supposed to represent a Greek church. Well, they’re both Orthodox churches so I guess it’s close enough for the funny pages.’